
In our earlier post on Point Differential, we talked about different ways of expressing the score:
Total number of points (ex: 104 to 103)
Point Differential (ex: 50.2% to 49.8%)
Sideout Differential (ex: 56% to 52%)
While each of these has value, Sideout Differential probably tells us the most information, because, in addition to telling us the margin of victory (or defeat), it tells us a little bit about how that victory (or defeat) occurred. A 70% to 68% Sideout Differential tells us something different than a 50% to 48% Sideout Differential. But what else can Sideout (or Point) Differential tell us?
In terms of Sideout/Point Differential, there’s 6 scenarios that can happen:
We have a large positive differential and win the match.
We have a large negative differential and lose the match.
We have a small positive differential and win the match.
We have a small positive differential and lose the match.
We have a small negative differential and win the match.
We have a small negative differential and lose the match.
(There’s also the scenarios where the differential is zero and we either win or lose, but those are similar enough to scenarios 3 through 6 to lump them in together.)
Scenarios 1 and 2 aren’t too interesting. Well… maybe interesting in some ways, but in terms of statistical analysis, not so much. You were either much better or much worse than your opponent that day and there was a gap in fundamental skills. Small tactical adjustments aren’t going to erase a 7-point lead.
Scenarios 3 through 6 on the other hand, are a lot more interesting to us from a statistical perspective, and these scenarios are ones where little things can tip the balance of the match one way or the other.
These four scenarios recently played out in the NCAA Women’s Volleyball Final 4. Let’s take a look, using our handy GMS Stats app to produce the analysis.
In our post breaking down the Final Four match between Illinois and Nebraska, we saw scenarios 4 and 5 play out, depending on which side you were rooting for.
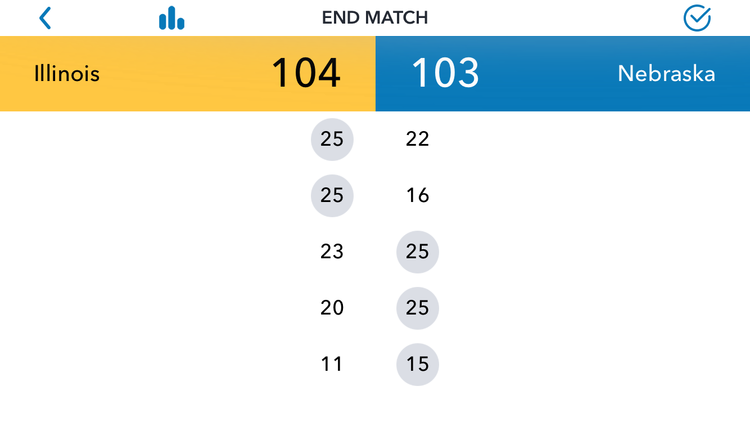
Illinois Point Differential Screen, GMS Stats app
Illinois outscored Nebraska, but lost the match. Or, if you’re a Nebraska fan, Nebraska got outscored, but won the match. This is uncommon, but it does happen. In a 5-set match, the team that scores more points only wins about 78% of the time.(*) On the flip side, we have the Stanford - Nebraska Championship Match:
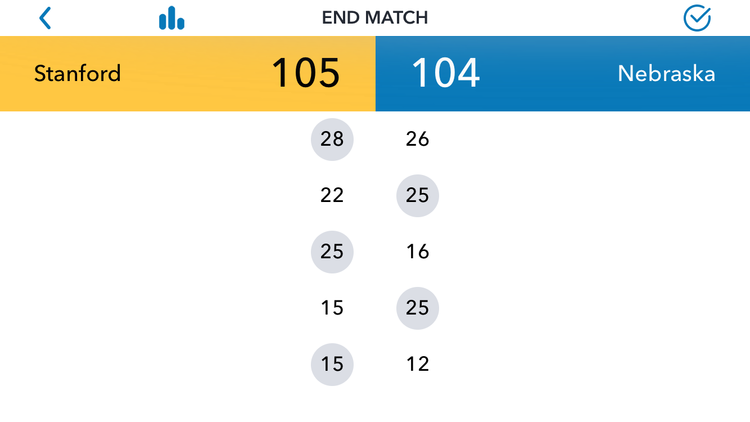
Stanford Point Differential Screen, GMS Stats app
On average, the margin of victory in a 5-set match is about 5 points, so these two matches were close even by 5-set standards.
In the post on that match, we looked at some of the rotational matchups and how they played out. A lot of times, these matchups can be the difference in a close match. Rotational order, matchups, and clutch play are the three things I like to look at in close margins of victory.
The danger with looking at one match is that there’s a lot of randomness involved. Is that rotation in which you gave up a late-game run really a bad rotation, or did you just catch a hot server at the wrong time? This is why we like to take a multi-match view of things. In the GMS Stats app, we built that into the Wizard feature:
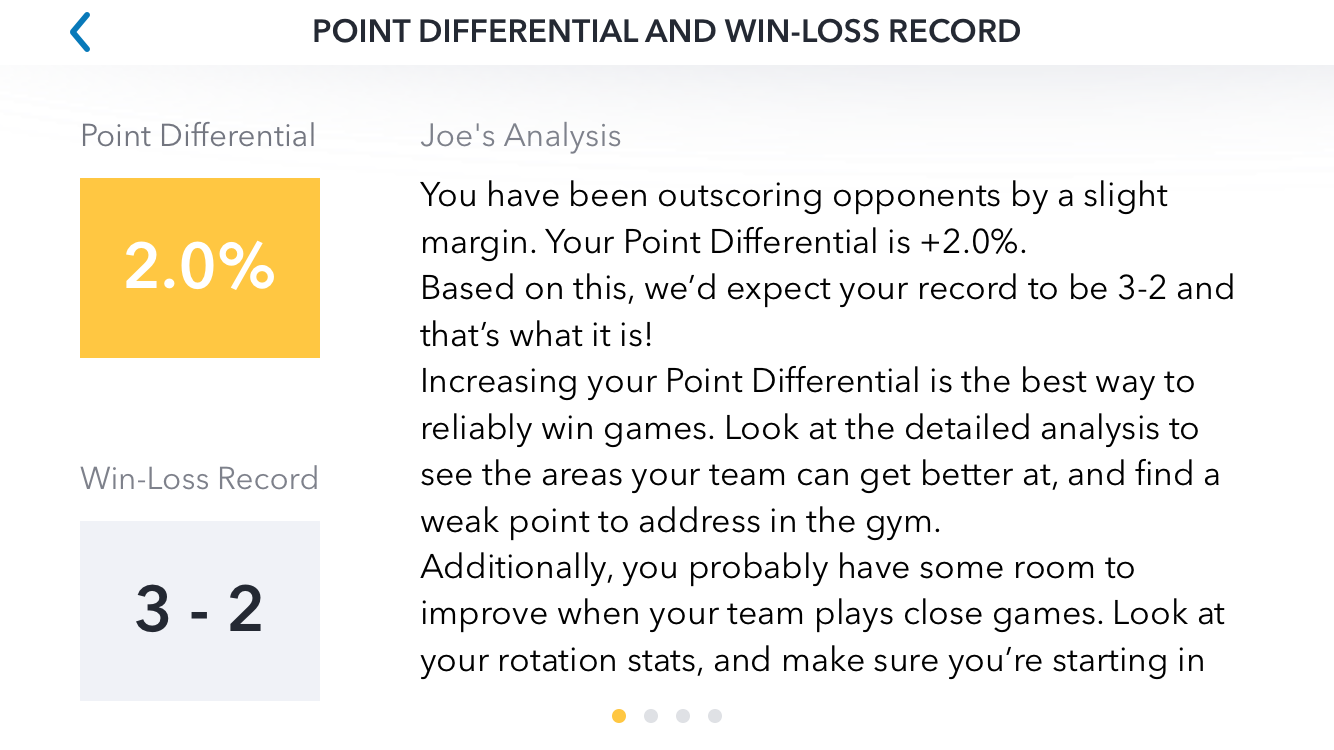
Point Differential Wizard Screen, GMS Stats app
This is the Wizard screen I pulled from a 5-match sample. I was coaching a professional team and wanted to see how our performance translated into wins and losses. For a single match, this translation is simple: if you outscore your opponent, you expect to win the match. If you get outscored, you expect to lose.
But things get trickier over multiple matches. If your Differential is 2% over a half-season, what do you expect your record to be? How about 5% or 10%? Fortunately, the Wizard feature does these calculations for us!
In this 5-match sample, we had a small but meaningful 2% edge over our opponents and that resulted in a 3-2 match record. Intuitively, we probably sense that this is about right. Maybe, we figure, we might be able to go 4-1, but 5-0 feels like a stretch. On the flip side, since we’ve outscored our opponents, we probably feel like 2-3 would be a letdown and 1-4 would indicate that something is really wrong.
Over time, this Point Differential-to-record translation can give us coaching insight. We can now imagine the previously mentioned scenarios reducing down to:
We are outscoring our record.
We are underscoring our record.
If we were 5-0 with a differential of only 2%, this would tell us some things as coaches. The first thing it would tell us: don’t get too cocky just yet, we’re probably getting lucky! It would also indicate that, while the results are good now, we should still be looking to make some changes if we want to keep the winning streak alive. There’s always the temptation to not make changes when the team is winning, but in this scenario, changes might still be warranted.
If we were 2-3 or 1-4 with a positive point differential, it tells us something different. First of all, it tells us that we’re not doing quite as bad as we think! So, while some changes are probably necessary, they might not need to be as drastic as the record might indicate. It also tells us that we’re probably losing some close games, and we have an opportunity to close them out better.
In this case, we look at our three Close Game Factors:
Rotation Order
Matchups and Scouting
Clutch Play
More on these factors in our next post!
(*) 5-set win % and margin of victory data provided by Volleytalk legend The Bofa on the Sofa.