
In the 2018 NCAA Women’s Volleyball Championship, Stanford edged out Nebraska in a close 5-set match. We saw in this post that Nebraska won their semifinal match over Illinois despite being outscored by 1 point. The margin in the final was the same, but this time Nebraska wasn’t able to pull it out.
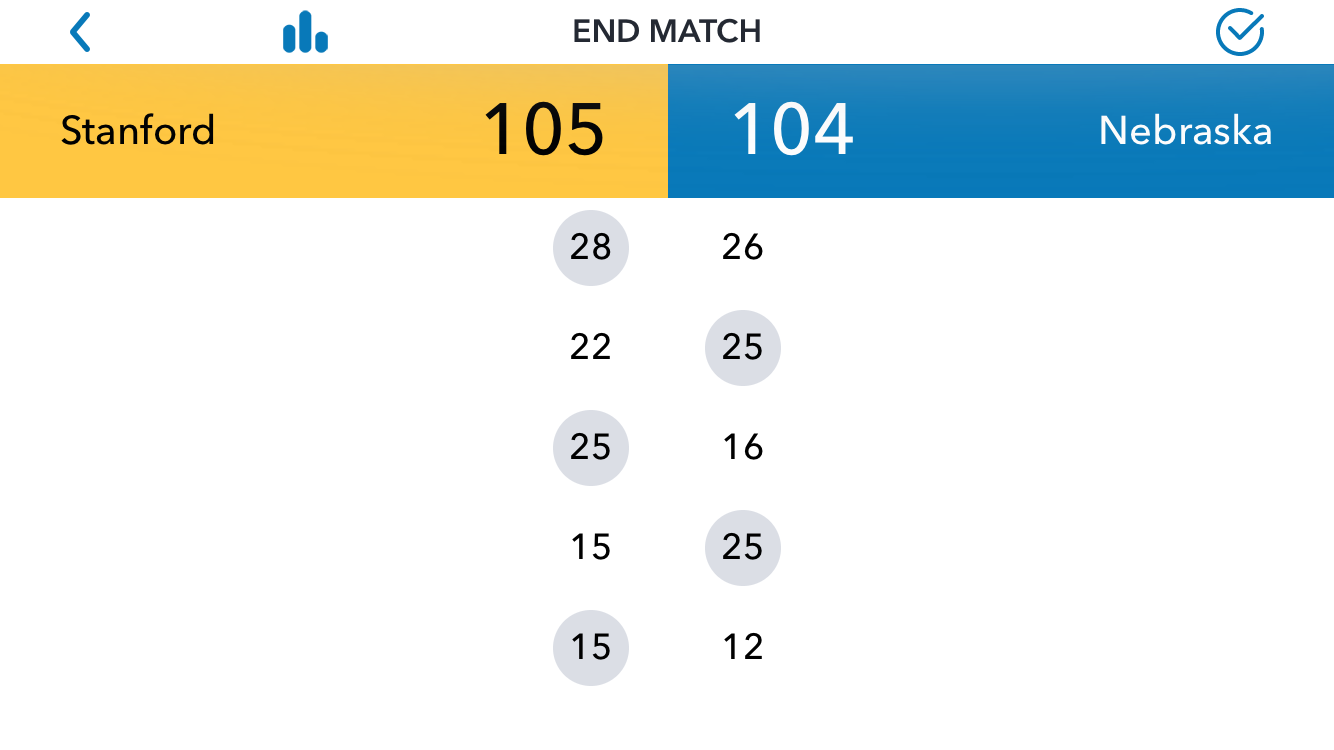
End of match screen. GMS Stats app.
The first two sets were close, but sets 3 and 4 saw each team trading blowouts. In an eerie recall of the semifinal vs Illinois, a challenge decided a crucial point late in the 5th set, but this time it didn’t go Nebraska’s way. Stanford won the 5th and earned their 8th National Championship.
In a match this close, we expect the margins to be thin statistically, and that was the case in this match.

Stanford Point Differential Screen
Both teams were at about 59% sideout for the match, which, while lower than their season averages, is also higher than either team typically allowed. This is common- seeing the overall sideout rate in a match between two top teams end up about halfway between what those teams sided out and what they allowed against most other opponents. Let’s break down the statistics more to see if they can tell us where the slim margins of victory came from. All screens and statistics courtesy of the GMS Stats App!
When I analyze a match, the first thing I do is look at the overall Point Differential, and see the Sideout level for the match as a whole. The next thing I like to do is look at the 3 Key Factors to Sideout. We’ll look at both the Stanford and Nebraska Sideout Key Factors to see the similarities and differences.

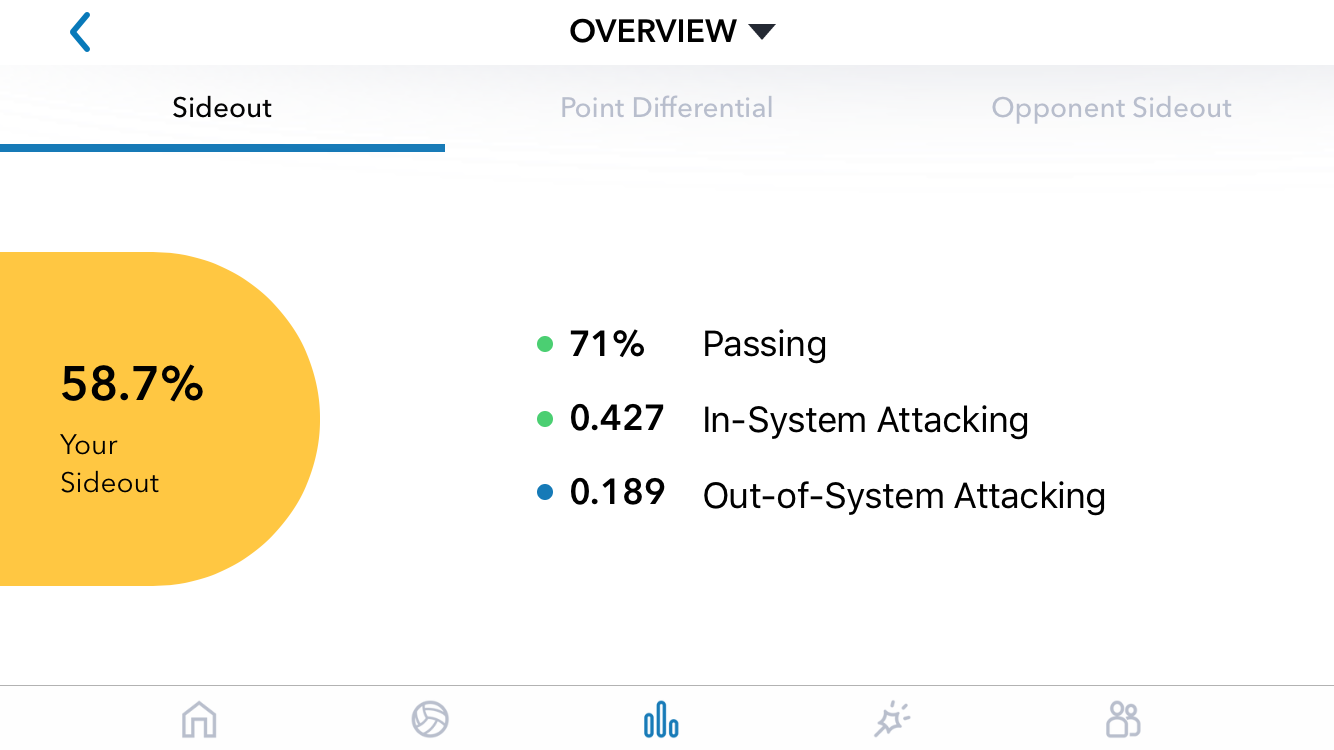
Stanford Sideout Key Factors
Nebraska Sideout Key Factors
Plenty of similarities here. Both teams passed well. Nebraska hit significantly better In-System (attacking after a Good Pass) than Stanford, but Stanford was better Attacking Out-of-System- after a Bad/Medium Pass or in transition. So Nebraska was In-System a lot, and hit well when they were. That’s usually a recipe for success. Let’s look at the defensive side of the ball to find out a little more information.
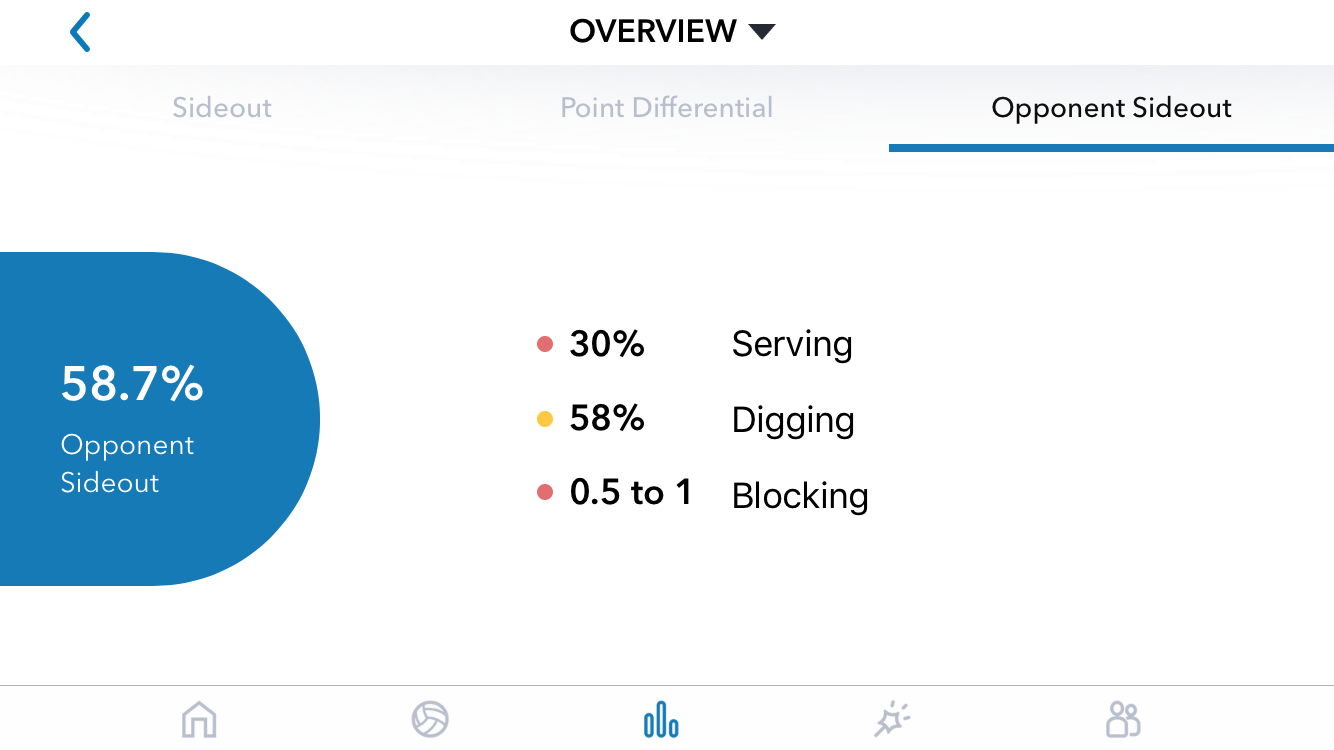
Stanford Opponent Sideout Screen

Nebraska Opponent Sideout Screen
Again, plenty of similarities. Nebraska dug a bit better while Stanford blocked better. Blocking can be a deceiving stat because while Stanford only outblocked Nebraska 10 to 9, they did so while only giving up 22 tools/block errors, while Nebraska gave up 34. Hitters on both teams scored off the block well, but Stanford was better here. However, this was compensated by Nebraska being the better defensive team. Again, percentages come in handy. Both teams had 69 digs, but Nebraska dug those 69 balls on 100 chances, while Stanford had 119 chances to dig.
Since Nebraska hit better on the match, we see, as we often do, that backcourt defense has a bit stronger of an effect (in NCAA Women’s volleyball) than blocking on the opponent hitting efficiency.
Finally, we see the serving. Both teams knocked the opponents Out-of-System at a similar rate. All told, the Key Factor statistics were close, as you might expect when the Sideout % (and thus, overall points scored) is so close.
So what was the difference?
If we walk it back to the first image in this post, we see there were 209 total points scored this match: 105 by Stanford and 104 by Nebraska. Since Nebraska out-hit Stanford, we’d expect them to be better within the rally, and that was true. If we take away service errors and aces, and isolate only the points where a rally took place (meaning at least one of the teams got a chance to attack), we see the following:
Total Rally Points: 182
Nebraska: 94 (72 Kills, 9 Blocks, 13 Stanford Errors)
Stanford: 88 (65 Kills, 10 Blocks, 13 Nebraska Errors)
So indeed, Nebraska was 6 points better within the rally. But now let’s look back at the No-Rally Points, where there was either an ace or a missed serve:
Total No-Rally Points: 27
Nebraska No-Rally Points: 10 (2 Aces, 8 Stanford Missed Serves)
Stanford No-Rally Points: 17 (9 Aces, 8 Nebraska Missed Serves)
So Nebraska was 6 points better within the rally, but Stanford was 7 points better when no rally happened at all! We find that this happens quite a bit- the team that wins the match was no better, or even slightly worse when, “volleyball happened,” but a substantial margin in the serve-pass game can often compensate for that.
With so much attention on Stanford’s size and power at the net, and the flashy digs by libero Morgan Hentz, it’s easy to forget that the serve-pass game so often dictates the winner and loser, even (especially?) at the highest levels.